Friday’s reported increase of 160,000 in nonfarm payrolls was less than the recent average. This doesn’t mean much for the macroeconomic outlook and, therefore, shouldn’t and probably won’t mean much for the path of monetary policy.
Monthly nonfarm payroll gains bounce around a good deal and are substantially revised. Moreover, weather-especially winter weather–can dramatically affect the numbers. Remember that seasonal adjustment accounts for the typical effect of winter, not for the particular winter we experience. The CFE’s Jonathan Wright, one of the leading experts on this topic, regularly publishes a weather adjusted payrolls series. By his reckoning, this winter’s weather, including that nasty April in much of the country, may fully explain the weakness in today’s report.
More importantly from a policy perspective, we think that much discussion of the job-gains-to-policy link at present is deeply misguided. In particular, there is a view that the pace of job growth over the last year or so is dangerously high and must soon begin slowing lest we push the job market to the bursting point. In this view, we need upward adjustments to the path of interest rates until those job gains of over 200,000 a month slow considerably.
Let’s accept a deep truth: job growth at the recent pace cannot continue indefinitely: ultimately an increase in payrolls of over 200,000 per month must take the economy above any reasonable sense of sustainable employment, and this would be destabilizing. Conventional Phillips-curve reasoning goes like this. As slack in the labor market evaporates, wages are sure to accelerate. As real wage gains exceed the gains for labor productivity, corporations see their margins erode, and this prompts them to raise prices, a process that generate a destabilizing inflationary environment. By destabilizing, we basically mean that that the Fed may either respond so sharply as to risk recession or so weakly as to allow inflation to jump to unacceptable levels.
O.K., so if strong job growth persists too long it would ultimately set in motion an inflationary dynamic, and if that begins to build and prompts a Fed response that is too weak or too strong, bad outcomes would follow. But even acknowledging all that logic, still leaves us a country mile from the conclusion that we need slower job growth today.
Let’s consider instead an economy in which the job growth at a rate something over 200,000 per month continues for, say, another 18 to 24 months. The assertion that this would dangerously overheat the economy requires us to believe the Phillips curve mechanism, and also to believe that we have a pretty good grasp of the myriad factors that determine just when job gains translate into dangerous inflation pressures. At last summer’s Jackson Hole Conference, Jon Faust and Eric Leeper reviewed how well the best thinkers and policymakers have historically done in assessing these factors. The record shows essentially no relation between inflation outcomes and inflation forecasts based on real-time assessments of labor market tightness. In Faust and Leeper’s argument, the standard Phillips curve forces operate in the economy, but they are regularly swamped by those myriad other factors–disparate confounding dynamics. Faust and Leeper base their argument on the normal period before the financial crisis—you remember, back when things were comparatively simple. No one contends things are simple today, and, in our view, there is no reason to believe that the current pace for employment growth if continued for a year or two would risk a destabilizing inflationary environment.
Let us spin out these disparate confounding dynamics in the form of six degrees of separation between the current pace of job growth and those bad inflation outcomes.
1. Amid continued strong job gains, the labor force participation rate rises forestalling a tightening of the labor market
2. Amid continued rapid job gains, the labor market continues to tighten and the unemployment rate continues to fall, but sufficient slack remains so that little upward pressure on wages and prices emerges over the next couple of years.
3. Amid strong job growth, upward pressure on wages causes a rise in wage inflation, but labor productivity accelerates offsetting any inflation pressure
4. Amid rapid job growth, real wage growth rises above the rate of productivity growth, but inflation does not pick up as labor’s share of income rebounds from historic lows.
5. Amid strong job gains, inflation accelerates, but inflation expectations remain anchored and no destabilizing dynamic emerges.
6. Amid strong job gains, inflation accelerates and inflation expectations begin to climb. The Fed responds as the inflation becomes apparent, avoiding any destabilizing effects
The analysis that follows simply gives an illustration of these six points.
1. Amid continued strong job gains, the labor force participation rate rises forestalling a tightening of the labor market
Job gains need not imply a tighter labor market if the increase in jobs is met by new workers joining the labor force. Of course, it is widely accepted that the labor force participation rate (LFPR) over the longer run in the U.S. will be falling as the large baby boom generation retires. To put some rough numbers on this, take the 2016:Q1 participation rates by age cohort (Table 1, col. 2) and hold them constant for the next 2 years in what we’ll call a the no change scenario. Given the BLS’s reported population forecasts by age cohort, the demographics of our aging population over these two years would imply that the overall LFPR would fall by about half a percentage point to 62.5 percent.
| Actual | 2018:Q1 scenario | ||
| Age | 2016:Q1 | No Change | Upbeat |
| All | 63.0 | 62.5 | 63.5 |
| 16-24 | 55.4 | 55.4 | 55.4 |
| 25-54 | 81.4 | 81.4 | 83.4 |
| 55-64 | 64.4 | 64.4 | 65.0 |
| 65-74 | 27.3 | 27.3 | 27.3 |
| 75+ | 8.3 | 8.3 | 8.3 |
Table 1. Particiaption rates by age cohort. Source: data, BLS via Fred; scenarios due to authors.
But the participation rates are not constant by cohort. For example, the participation rate in the age 55-64 cohort has been increasing for over 20 years. And the participation rate of the 25-54 group has recently been rebounding from post-recession lows, jumping from 80.6 to 81.4 over the year ended Q1:2016.
Consider the following upbeat scenario (Table 1, col. 3). The 25-54 participation rate rises for the next two years at about half the rate it rose over the 2 quarters ending in March. After two years, this still leaves it well below its pre-recession peak. The steady rise in the 55-64 participation rate continues. The participation rates in the youngest and oldest cohorts remain unchanged. Using the same population numbers used above, the overall participation rises to 63.5 percent in the upbeat scenario, as compared to a fall to 62.5 percent in the no change scenario.
The implications of these seemingly modest changes in the participation rate are quite striking when one considers the pace of job growth and the unemployment rate. For example, the median FOMC forecast for unemployment in 2018:Q1 is just below 4.6 percent. Under the no change scenario, job gains of 110,000 per month would roughly deliver this outcome. In the upbeat scenario, it takes job gains of 220,000 per month to reach that same unemployment rate.
Modest adjustments of the participation rate by age cohort over the near-term could allow the current pace of job creation to continue into 2018 while delivering an unemployment rate that the FOMC projects is consistent with inflation rising slowly to 2 percent.
2. Amid continued rapid job gains, the labor market continues to tighten and the unemployment rate continues to fall, but sufficient slack remains so that little upward pressure on wages and prices emerges over the next couple of years.
Historically, as the unemployment rate falls to 5 percent, this has signaled a relatively tight labor market and a noticeable acceleration in hourly wage gains. This regularity helps explain why most FOMC members report something like 5 percent for the long-term normal unemployment rate. In the past, however, those 5 percent jobless rates were generally accompanied by similarly low levels for other measures of labor market slack. Today, as the Fed regularly reminds us, many broader measures of unemployment remain much higher than the past relation with headline unemployment would predict.
For illustrative purposes, Fig. 1 shows the conventional (U-3) unemployment rate alongside a broader measure that we’ve constructed. The broader measure includes U-3, the rate of involuntary part time work, and a measure of prime age participation rate shortfall. From 1985 to the crisis, the two measures mirror each other, and, in particular, both measures tended to dip below 5 percent at the same time. Currently the more comprehensive slack measure stands above 6 percent–more than a full percentage point above the conventional unemployment rate.
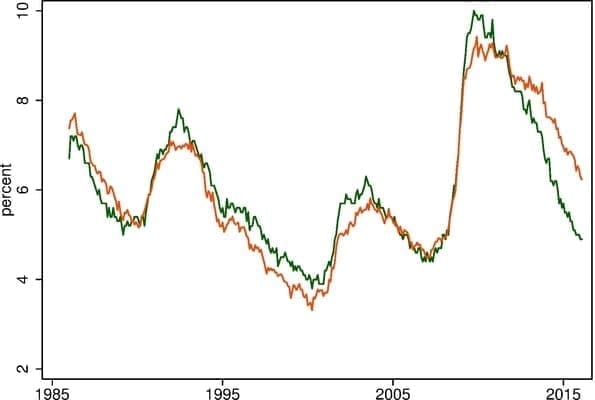
Fig. 1. Conventional unemployment rate and broader measure. Sources: BLS via Fred, and authors’ calculations.
Given the similar behavior of these two measures in past cycles, historical data is not much help in sorting out which-if either-gives a reliable signal of when labor market tightness is causing significant wage pressures. [1] The alternative measure suggests that we may have a couple more years of labors market progress of the sort we’ve been seeing before inflation pressures emerge.
3. Amid strong job growth, upward pressure on wages causes a rise in wage inflation, but labor productivity accelerates offsetting any inflation pressure
Strong job growth could well drive the jobless rate lower and also be associated with the acceleration in wages that standard Philips curve thinking might predict. These developments could, however, be accompanied by more rapid labor productivity growth. Of course, real wage gains that are supported by higher productivity do not raise unit labor costs or put a squeeze on profits, and thereby need not put upward pressure on inflation. Given abysmal recent gains for productivity, perhaps expecting a jump in productivity sounds crazy—but we might be due for a compensating bounce. The point is that our understanding of productivity dynamics at present is quite hazy and this scenario cannot be dismissed.
4. Amid rapid job growth, real wage growth rises above the rate of productivity growth, but inflation does not pick up as labor’s share of income rebounds from historic lows.
If real wage growth exceeds productivity growth, this by definition puts pressure on profits. And in the standard slack-based account, this automatically translates into a cyclical rise in inflation pressure. But we have seen dramatic longer-term moves in profits in recent decades that are unrelated to inflation. In particular, profits as a share of national income have been abnormally high by historic standards for many years. A return to something more like normal profit conditions of the past 30 or 40 years might involve exactly the dynamic of real wages outpacing productivity described above, but with no corresponding rise in inflation.
This issue is more commonly discussed in terms of labors share of national income rather than the profit share. By most reasonable measures, labor’s share of income has been near historic lows in recent years. For example, the simplest of measure, compensation as a share of GDP, is shown in Fig. 2.
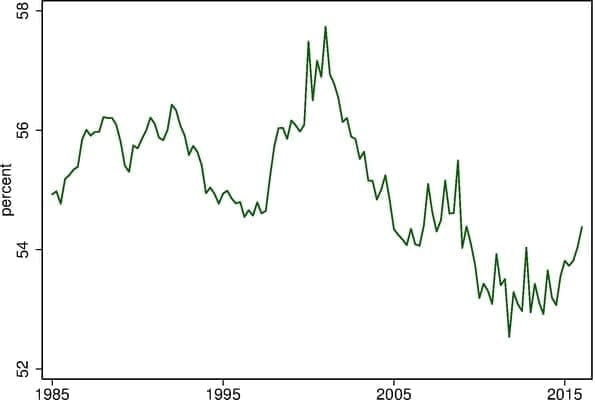
Fig. 2. Labor compensation as a share of GDP. Source: BLS via Fred.
Suppose that labor’s share were to bounce back by another one percentage point over the next two years. Given that the share is around one-half, to achieve this gain wage inflation would have to exceed the overall inflation plus the productivity growth rate by about a full percentage point for the two years.
For example, in a world of 1 percent productivity growth and 2 percent inflation, wage inflation of about 4 percent for two years would be required to achieve this modest bounce back of labor’s share.
5. Amid strong job gains, inflation accelerates, but inflation expectations remain anchored and no destabilizing dynamic emerges.
The U.S. economy has spent the past 4 years below target for both headline and core inflation with employment well-below its maximum sustainable level. Inflation expectations, at least until recently, seemed remarkably well anchored near 2 percent. Perhaps it is also possible that two more years of strong job growth would push employment and inflation above desired levels without threatening any destabilizing dynamic. The Fed has made clear that overshoots are not the intended effect of current policy. And if the overshoots happen, they clearly would involve some costs,[2] but there is no strong reason for presuming that this outcome must spiral into a destabilizing dynamic.
6. Amid strong job gains, inflation accelerates and inflation expectations begin to climb. The Fed responds as the inflation becomes apparent, avoiding any destabilizing effects
The slack-based route to inflation might, of course, emerge if the current pace of job growth continues for a couple of years. But if it does, the Fed might respond in some roughly appropriate manner and avert those destabilizing outcomes.
Leaping to the conclusion
Finally, we must acknowledge that a continuation of job gains such as those we’ve seen recently could elicit precisely the kind of destabilizing inflationary dynamic that seems to underlie much conventional thinking. Leaping to this conclusion requires us to leap those six degrees of separation. The case for intentionally promoting slower job growth at present seems to rest on this outcome being likely.
Dealing in historical reality rather than the popular myth, there is nothing to support the view that the Fed—or any economist or policymaker—understands the disparate confounding dynamics, well enough to warrant this preemptive unemployment. Yes, slowing job growth is a euphemism for more folks out of work longer.
The implications for interest rate normalization? There are many arguments for and against a gradual increase in short-term interest rates at present that do not rest on the merits of preemptive unemployment. The neutral interest rate may or may not be rising; rest of world weakness may or may not be worsening; other excesses may or may not be rising. We can have a good debate about these. The fear that too many folks will get jobs each month is not, for the near-term, a reason to tighten policy.
Notes:
1. The period from 1985 to the crisis was known as the Great Moderation and is often held up as a period when monetary policy based on slack-based reasoning was a success. We designed our measure to mirror U-3 over this period and then diverge. This may sound like cheating, but it is precisely the point of the Faust-Leeper analysis. There are many, many measures of slack which share much behavior but show disparate potentially confounding dynamics. Once we find a measure of slack that performs well by some criterion over a particular period, we still need to consider the myriad other similar measures that perform well over that period, but diverge after. [back]
2. And also some benefits. For example, the long undershoot of 2 percent inflation has led to an appreciable rise in the real future tax burden imposed by the government debt. Reversing some of this would be one benefit of an overshoot. [back]