Commodity price collapses tend to be a reliable signal of a broad-based global slowdown. For example, drops of 15 to 20 percent in CRB raw industrial commodities index [1] have reliably been associated with significant slowdowns in growth (Fig. 1).[2] The recent fall in commodity prices exceeds any decline since 1980 save the one registered during the depths of the global crisis of 2008-2009 suggesting a major slowdown.
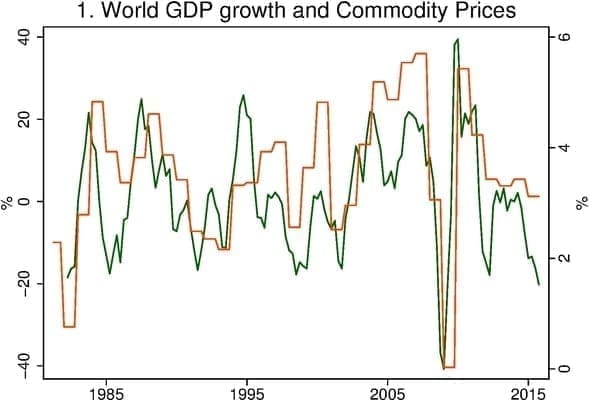
Notes: Growth in red (right scale), commodity prices in green (left scale). Four-quarter change in the log of the quarterly average CRB/BLS raw industrials index; source: Bloomberg. Year on year percent change in world GDP at constant prices; 2015 data are forecast; source IMF WEO Oct. 2015 database.
So far, though, official tallies only suggest a modest global growth slowdown in 2015, and a popular story line envisions a sharp 2016 GDP growth slowdown that would validate the powerful fall for commodity prices. This may turn out to be correct, but the timing would be peculiar. Historically, commodity prices have moved largely coincident with big shifts in growth, and have not led them.
Another possibility deserves serious consideration: perhaps global growth fell substantially more in 2015 than is reflected in the data. How? Think China.
Nearly all commentators on China acknowledge that Chinese GDP figures are a political confection. One bit of evidence on this is that announced growth seldom deviates from the preannounced target by more than a tenth of a percentage point or two. But exaggerated Chinese growth numbers can substantially change your view of global growth. Over the last 20 years, China has grown to have about a 15 percent weight in standard global GDP measures, implying that 3 percentage points of phantom growth added to China boosts global growth by about half a percentage point.
Despite the fact that most China watchers acknowledge that official Chinese figures are not to be trusted, China’s offer, a 6.8% pace of expansion, seems to be the starting point for anyone offering up opinions about the Middle Kingdom. Nobel Prize winner Daniel Kahneman reminds us that anchoring can profoundly affect judgments. The official Chinese target for 2015 was 7% and in September the IMF put Chinese growth at 6.8% for 2015. While private forecasters suggest a slower pace, few seem to be talking about adjustments of more than a percentage point or two. [3] Again, if your point of reference is a 6.8% claim, the gravitational pull of that figure may be understandable. But given that the official number mainly seems to reflect what Chinese officials pledged GDP growth would be, it probably should not bear much on your tally of the outcome.
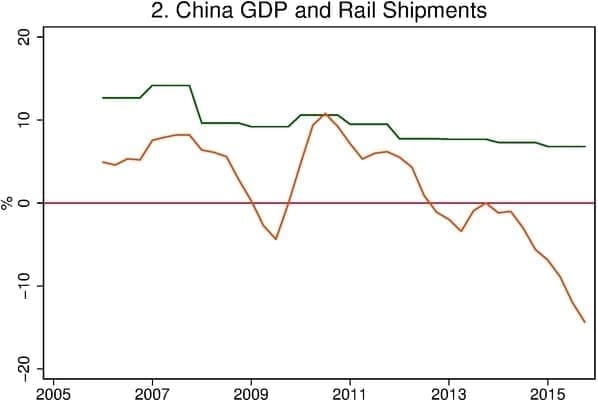
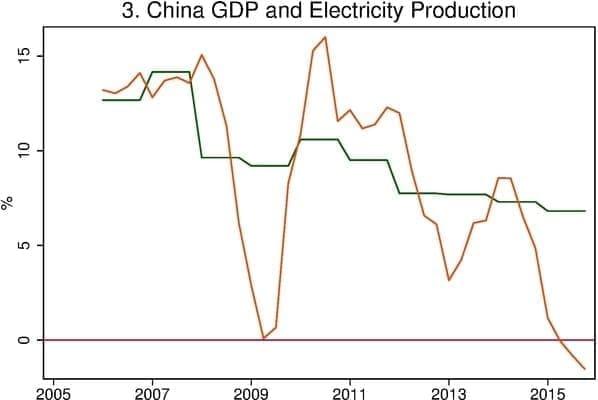
We see good reasons to think that Chinese growth may have been very weak in 2015. There are certainly powerful theoretical arguments that suggest that China’s growth rate has been destined to slow sharply. For example, Michael Pettis, at the University of Beijing has been making the case that unprecedented reliance on debt to prop up expansion would force a sharp slowing. If we ignored the GDP figures and focused on other economic barometers, we’d see a sharp slowing in 2015. Growth in electricity production and growth in rail shipments (shown in Figs. 2 and 3) have plunged, with declines that are far more than would be consistent with a modest slowdown in GDP growth. Rail shipments fell 16% over the four quarters of 2015. Electricity production was flat. The deterioration of both indicators far exceeds the retrenchment recorded during the depths of the Great Recession. Nearly seven percent GDP growth amid flat electricity production? One needs to believe in an unprecedented advance in efficiency, or embrace the notion that the GDP number is a fiction. [4]
Note: Growth in green; shipments in red. China year on year percent change in electricity production; source: Bloomberg. China year on year percent change in real GDP from IMF WEO Oct. 2015 database; the 2015 data are forecast.
Note: Growth in green; electricity in red. Year on year percent change in China rail freight traffic; source: Bloomberg. China year on year percent change in real GDP from IMF WEO Oct. 2015 database; the 2015 data are forecast.
Chinese officialdom, since late 2015, may be giving us the best indication, admittedly obliquely, of the fanciful nature of the 6.8% claim. Policy steps are now being taken, in an effort to right the ship in China. The Chinese have allowed the Renminbi to depreciate significantly against the dollar. And word of plans to deliver significant stimulus in 2016 have been announced in recent days. If your target was 7% growth and 6.8% arrived, would you be in the ’big additional stimulus’ business?
Let’s suppose that Chinese growth was more like 2.5 percent in 2015. This would put world growth at about 2.5 percent, which would be much more in line with the story told by commodity prices (Fig. 4).
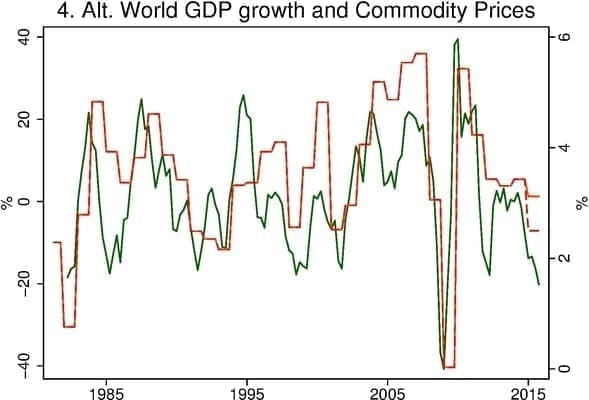
Note: This repeats Fig. 1 with a dashed line added for world GDP growth in 2015 after setting China’s GDP growth to 2.5 percent in 2015.
Lest we sound like the Grinch on the eve of Chistmas, let us emphasize that there is a bright side to this story. Accepting that China’s economy was already in deep distress in 2015 could significantly improve your world outlook for 2016. If we stick with the official Chinese data, then the collapse in commodity prices and those other Chinese indicators suggests that there may be another shoe to drop in 2016. If the shoe has already dropped and Chinese authorities are now committed to rekindle growth in 2016, as some discussion suggests, then both global and U.S. prospects actually look a bit brighter. Thus, from a global and U.S. policy perspective, the story we are offering holds out the hope of somewhat better news in 2016.
But this outcome is far from guaranteed. Even if the possibility we are raising is correct, there remain important questions about where growth will come from in China in 2016 and thereafter. Many argue that the transition to a new engine guarantees several years of, at minimum, slow growth. One thing, we believe, is clear: China policies and outcomes are likely to be a main storyline driving policy all over the world in 2016.
Notes:
1. The CRB raw industrials index excludes energy commodity prices. Wars, embargos and other non-economic momentum developments, on many occasions, have driven energy prices. The CRB raw index, by excluding these items, better captures signals of economic momentum. Obviously, in current circumstances, including energy commodity prices would bolster the case for a sharp fade in global momentum. [back]
2. The main exception over the 1980-2015 span occurred around 1985, a period in which the dollar rose by a spectacular 55%. Over the latest 12 month’s the dollar’s climb is roughly 10%. [back]
3. For example, see the discussion in Josh Noble, Doubts Rise over China’s official GDP growth rate, Financial Times, Sept. 16, 2015. [back]
4. China is attempting to shift the mix of output away from investment and toward consumption, and this could account for some slippage in the link between rail shipment or electricity and GDP growth. But even in China such transitions happen relatively slowly and could only account for a small part of this dramatic change. [back]