The housing crisis from a decade ago is fading from consciousness for many Americans. But the ill effects of it are still apparent, particularly for those who bought homes in the years from 2005 to 2007. They paid high prices, and many mortgages had ominous terms that made repayment highly unlikely.
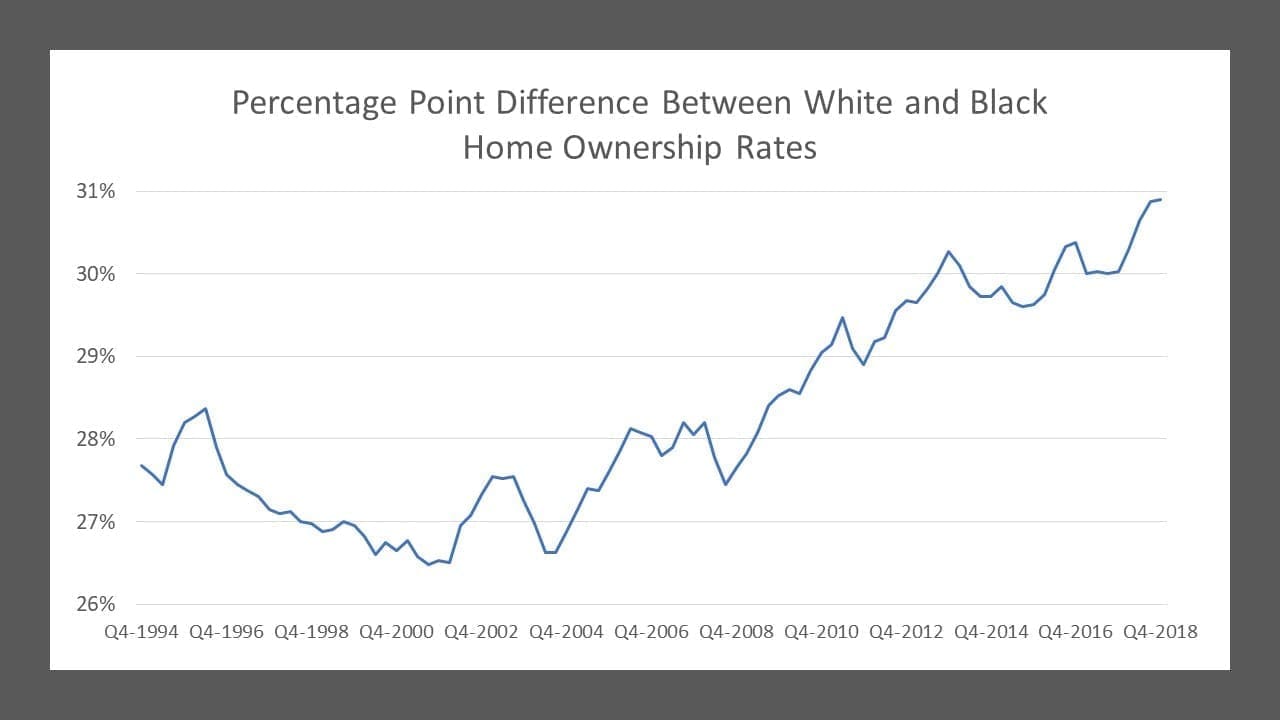
The problem is most acute for blacks, whose home ownership rates rose at an impressive pace during the final years of the housing bubble, but now have fallen so far that the gap between the white and black rates of ownership reached the highest level ever recorded in 2018.
Another group that has suffered is those who are now 35 to 44 years old – meaning they were 24 to 33 in 2007 and at an age when home ownership is usually increasing. Many who bought then seem to have lost their homes.
The Census Bureau reported Thursday on home ownership rates at the end of 2018 – a report that was delayed by the partial government shutdown. It found an overall rate of 64.6% of households owned their own homes, up from 64.4% three months earlier. Those figures are seasonally adjusted.
The home ownership rate has been calculated by the government since 1980. It slipped a bit in the early 1980s, a time of recession and very high interest rates that severely dented the housing market. It remained fairly steady, at around 64% of households, through 1994.
But then, as home price increases began to outstrip overall inflation, the homeownership rate moved up, until it peaked at 69.2 percent in early 2005.
The gain was seen as proof that opportunity was spreading. “The academic argument for increasing home mortgage lending to lower-income people was that expanding ownership stabilizes communities while building up equity that could eventually serve as future collateral,” notes Reuven Brenner, a McGill University economist, in the current issue of American Affairs. “President George W. Bush, a vocal proponent of increased mortgage lending, explicitly called for an ‘ownership society.’ ”
Brenner argues that the government efforts to boost ownership were poorly designed. “Instead of providing equity and down payment assistance, Congress crafted measures that increased maximum allowable mortgage debt and reduced minimum thresholds of creditworthiness,” he writes. “At the same time, regulators failed to rein in specialty mortgage companies which made some of the worst loans precisely because they were not subject to bank regulations.” Of course, the housing bubble extended well beyond sub-prime borrowers. Affluent homebuyers held only a third of delinquent mortgages in 2003, but accounted for half of delinquent mortgages by 2007, an MIT study found.
The resultant bursting of the housing bubble led to millions of foreclosures, as well as millions of lost jobs, in the 2007-2009 recession.
More than 70% of subprime mortgages issued from 2004 to 2006 had “teaser” initial interest rates that would soar within a few years. Homeowners would have struggled even if home prices had not collapsed.
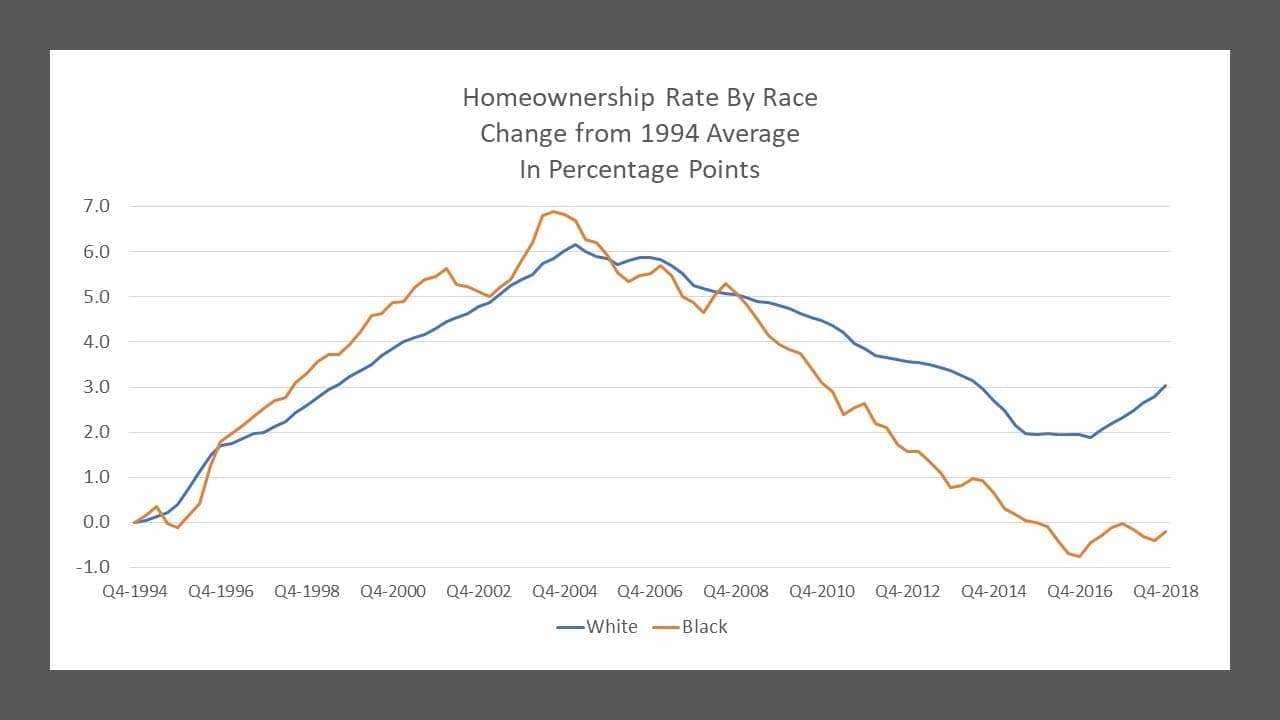
For a time, blacks appeared to be gaining. Their home ownership rate, always far lower than that of whites, rose more rapidly during the bubble, particularly as it neared its end. (Because the government does not seasonally adjust the figures for specific groups, the figures used in this article and in the accompanying charts refer to four-quarter moving averages.)
In the aftermath of the bursting bubble, the ownership rate for whites never fell as low as it was in 1994, the first year figures were broken down by race. The rate for blacks fell to a lower level, and while it has recovered a little, it remains below 1994 levels. In 2018 the average rate for whites was 73%, and the rate for blacks was 42.1%.
That difference, of 30.9 percentage points, is a record for any calendar year. The gap was 30.0 points in 2017, and just 26.4 points in 1994.
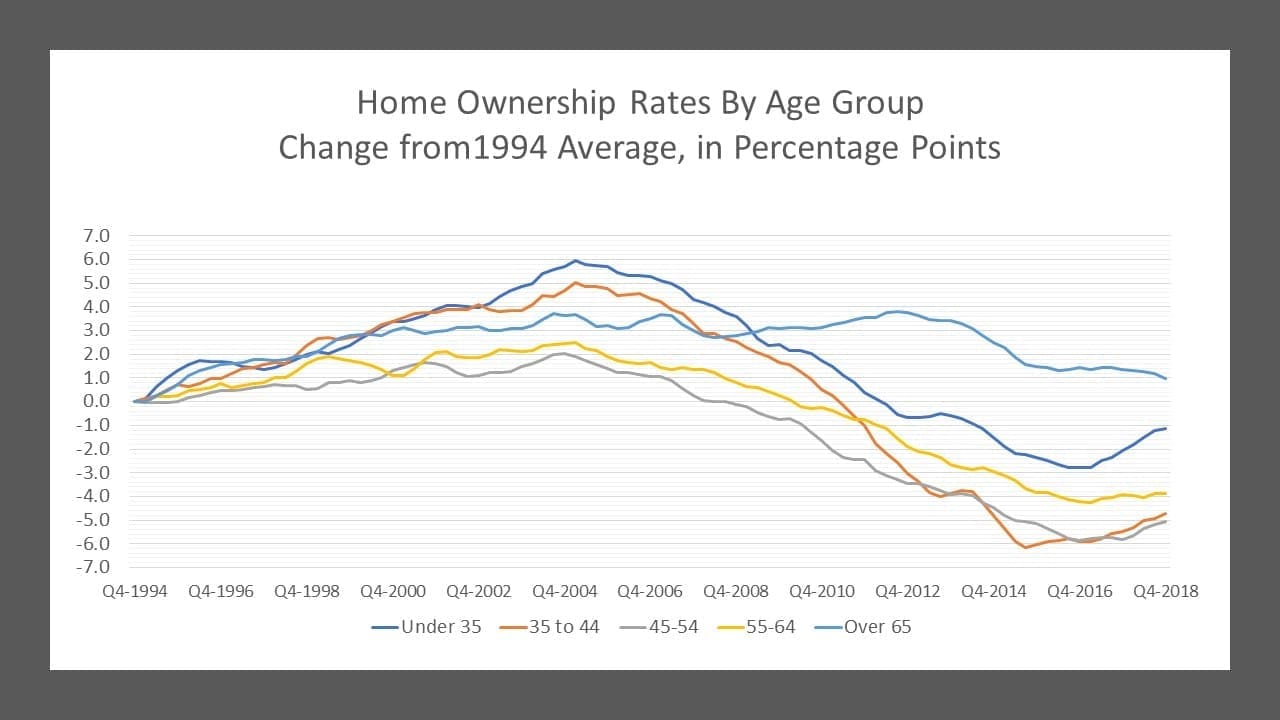
A similar story is visible in trends of various age groups. They are, of course, composed of different people over time; those who were under 35 in 2018 were no older than 21 in 2005, when the home ownership rate peaked. Very few of them had the opportunity to buy houses during the bubble.
It is a different story for those a little older. Those who were 35 to 44 in 2018 were 22 to 31 in 2005. And those in the next higher age group, 45 to 54, were 32 to 41 in 2005. Many of them did buy homes for prices that soon came to be well above market value.
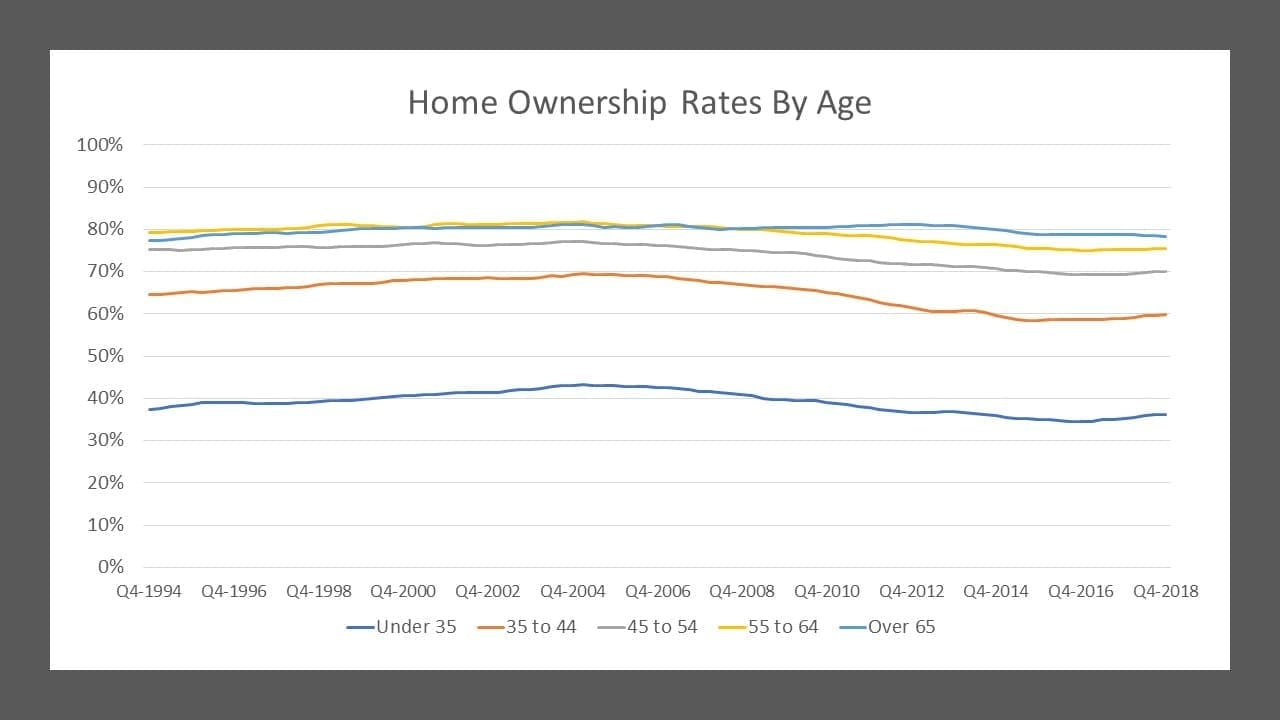
The result can be seen in the data. Those two age groups now have ownership rates about five percentage points lower than was the case in 1994 for their predecessors. The under-35 and 55 to 64 groups are lower, but not by as much. And the rate for those over 65 is higher than it was in 1994.
That all groups were affected is a reflection of the changing mortgage market in the decade leading up to the financial crisis. Home equity loans and cash-out mortgage refinancings were heavily promoted, and many homeowners used them to get cash for all kinds of things. When home prices fell in previous cycles, the only homeowners left without equity were those who had bought their homes shortly before prices began to fall. By 2007, it became possible for people who had owned their homes for decades to see their equity wiped out, and many did.
But the worst affected were those who bought near the end of the bubble. It was a case of last-in-first-out. And it appears many of those people never got back in.