Get ready for another crazy month on Wall Street. Months like March tend to come in pairs, at least as far as volatility goes.
Daily moves of 4% or more are usually rare for the S&P 500; there were only ten of them in the entire decade of 2010 through 2019.
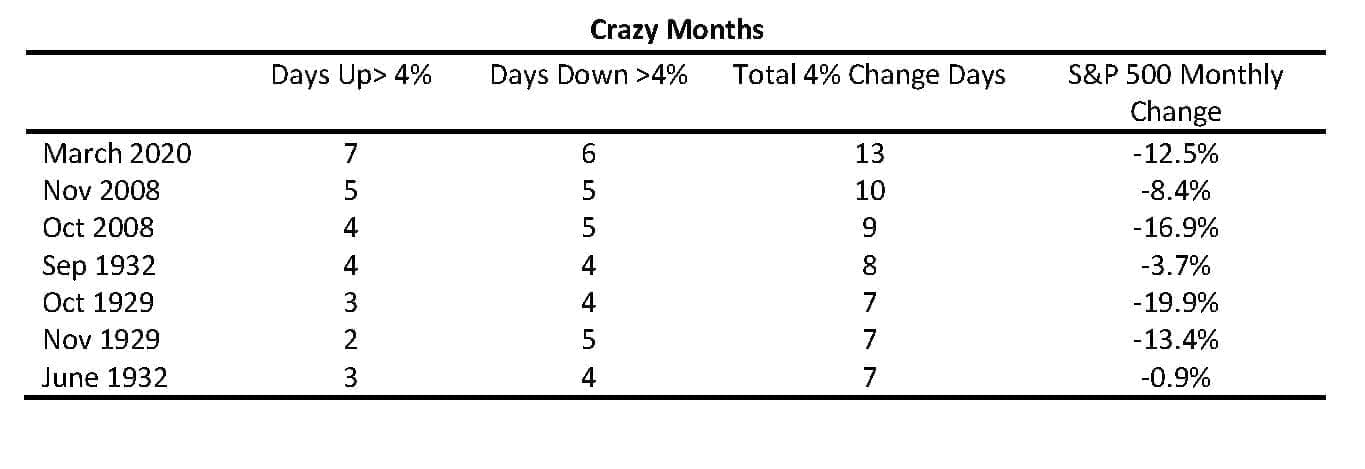
In March, there were a record 13 such days. Perhaps surprisingly, more of them were up than down, although the index ended down 12.5% for the month.
There have been only six previous months when there were as many as seven very big days. There were two in 1929, two in 1932, and two in 2008. In 1929 and 2008, the months were consecutive, as horrible news racked Wall Street.
In 1929, the stock market crash that preceded the Great Depression produced seven such days in each of September and October – and the S&P fell 31% over the two months.
In 2008, the financial crisis that begat the Great Recession produced nine such days in October and ten in November. The market lost 23% over those two months. Count in September, the month that Lehman Brothers failed, when there were six such days, and the three-month loss was 30%.
In 1932, the Depression got worse as the Hoover Administration seemed unable to deal with it, and there were seven big days in June and eight in September. The index was down 15% for the year, but there was a huge rally in July and August, the months between the two very volatile months. And the S&P 500 reached its lowest level ever on June 1, 1932, down 86% from the 1929 record high.