The Congressional Budget Office has issued some dire forecasts about the U.S. economy, which is causing alarm in some quarters. But do those forecasts make sense?
As Andrew Van Dam wrote in the Washington Post:
“CBO now projects growth will slow to 1.1 percent in 2023 and an average of 1.2 percent in 2024 and 2025 — the slowest sustained growth the U.S. has seen outside of a recession, according to Commerce Department data going back to 1929. Before the pandemic, the CBO projected steady growth of between 1.6 and 1.8 percent, rather than a dramatic boom and a leveling off.”
He goes on to conclude:
“Yes. U.S. economic output…will be higher in the coming years than it would have been if the American covid-19 response hadn’t been as aggressive. But there’s a catch …. it’s likely that, because the boom of 2021 and 2022 helped GDP reach its potential more rapidly, the rate of growth in 2023 will be slower than it would have been without stimulus”
Is it likely? The CBO forecasters had to acknowledge the reality of recent surging labor productivity. But rather than view that change as significant, they chose to insist that their earlier guess for sustainable productivity gains was correct. That completely arbitrary decision led them to forecast meagre prospective productivity growth ahead, and is central to their forecast of a swoon for 2023-2025 real GDP growth.
CBO’s insistence on this dour view forces them into pretty improbable territory. Glance at the chart below. It reveals that the flow of output, second half 2021, is deemed to already be well above the economy’s potential. With unemployment still close to 6% and with labor force participation still quite depressed, declaring that the economy is already in excessive territory, seems hard to support. I think it is flat out wrong.

Deconstructing CBO’s Potential Output estimate
CBO’s characterization of potential is driven by three assumptions. Sustainable annual gains for U.S. labor productivity will average around 1.8%. Full employment for the U.S. economy is centered a bit above 4%. At full employment U.S. labor force growth is capped at around 0.3% per year. Combine these three items and you end up sketching out CBO’s version of the upside boundary for U.S. real GDP.
Again, however, embracing these assumptions forces you to assert that the economy, as we enter the second half of 2021, is already operating above its sustainable level, strikingly at odds with common sense amid very high joblessness, very low labor force participation and very low levels of capacity utilization for our industrial sector.
How might we modify an estimate of potential, so that it squares with the notion of ample excess labor and production capacity, mid-2021? Simply acknowledge that the spurt for productivity, over the past 6 quarters, need not be followed by a productivity swoon.
Additionally, we can revisit the question of full employment. CBO asserts that employment levels extended beyond safe levels, throughout 2018 and 2019. But there was little evidence of wage and or price pressures in late 2019. Labor force conditions then may have been at, but not beyond full employment after all, at that time.
Consider those two factors, and a post-boom 2%, not 1%, real GDP growth performance is easy to pencil in.
Productivity’s Trajectory Need Not Mean Revert.
CBO embraces the pre-pandemic consensus view on sustainable productivity gains, 1.8% per year. But over the 6 quarters ending in 2021:Q2, labor productivity wildly outstripped this performance, rising at around a 3.4% annualized pace, nearly double CBO’s sustainable rate.
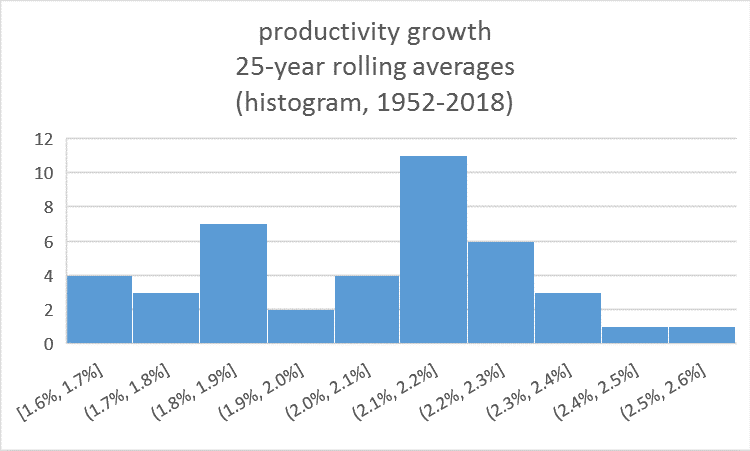
Does it make sense to be adamant about sustainable productivity levels? Not really. Since 1950, long run average growth rates for labor productivity are neither stable nor predictable. They range anywhere from 1.6% to 2.6%, putting CBO’s figure on the very low end of post war history.
Where did CBO come up with 1.8%? That is the bad news performance of the previous expansion. But CBO’s insistence on continued poor performance, despite nearly two years of boom, seems awfully conservative. Indeed, it amounts to insisting that good productivity news today, rather than a reason to revise up expectations for prospective productivity, necessitates a forecast of dastardly productivity performance and depressing economic growth news tomorrow.
CBO could have taken a somewhat less dour approach. They could have stuck to their guns about full employment levels and sustainable long-term productivity and labor force trajectories. But they could have attached theses trend trajectories to the elevated output levels achieved amid the boom. Simply allowing the economy to pocket the gains delivered by recent great productivity news would put 2025:Q4 3% higher than CBO’s current forecast.
Optimists could go further. They could envision an important upshift in the longer run trajectory for economic growth. Can two years of boom help us break out of the doldrums of piddling productivity growth and depressed labor force participation—the U.S. economic reality of the past two decades? Lift labor productivity to the mid-point of its post war range, 2.3% per year, and real GDP, 2025:Q4, is 5% higher than CBO’s current projection.
Reconsidering Full employment Levels
Similarly, CBO identifies 2018:Q1 as the period in which the U.S. economy slightly eclipsed full employment. At that time the jobless rate was at 4% and 25-to-54-year-old—prime age—workers’ participation rates stood at 82%. By 2019:Q4 the jobless rate had fallen to 3.5% and prime age participation had rebounded to 83%, and amid these further gains for employment no discernable wage acceleration appeared. If we choose to identify 2019:Q4 as full employment, then the potential labor force, 2025:Q4 is roughly 1% higher than CBO’s estimate, offering more room for growth before hitting labor market ceilings.
Worshipping at the Altar of No Free Lunches.
Why does CBO insist that short term gains require outyear pains? Take a step back and the message embedded in the updated CBO forecast is clear. CBO, and many conventional analysts will not allow short-term stimulus to change their guesses about the economy’s long-term trajectory. They must embed today’s stimulus supported boom, because we are knee deep in it. But they marry to it mean reverting arithmetic that force the economy back to their pre-boom guess for its sustainable level. The economist mantra, there is no such thing as a free lunch, is a powerful notion, and it leads many economists to insist on dangers that they simply should acknowledge are largely speculative.
To be sure, I cannot guarantee that an enduring boom for productivity is taking hold, any more than CBO can assure us that the U.S. economy is destined to toe the line on potential GDP estimates that conventional analysts conjured up well before the pandemic and the boom.
What is the exciting thing about current circumstances? We are booming today. How much enduring upside will this deliver? As I wrote early this year, thanks to super-sized stimulus we are set up to find out.