The FOMC minutes released yesterday and today’s CPI data release underscore a remarkable shift. Over the past five years, the state of the labor market has dominated monetary policy discussions, but for the first time since the crisis inflation is now taking center stage. All through the recovery, of course, inflation hawks have warned that inflation would soon demand our attention. But probably neither hawks nor doves predicted that excessively low inflation would be our concern as unemployment moved closer to normal. And yet today’s CPI data and the FOMC commentary reported yesterday remind us that, in the short run, inflation is probably headed lower.
Today and in coming months, analysts at the Fed and elsewhere will be parsing the data and squinting extra hard to see signs that inflation will, without additional policy measures, move back up to desired levels. The difficulty, of course, is that factors such as the falling price of oil and of other commodities and the rising value of the dollar are putting downward pressure on inflation.1 A centerpiece of inflation analysis in situations like this is examining the behavior of sub-components of inflation that are less likely to be affected by transitory forces. These indices, one hopes, will give a clearer sense of where a shadowy beast known as underlying inflation may be headed. The baseline view of many analysts is that underlying inflation is headed slowly back to the Fed’s objective. This may be the right baseline, but recent data have, in our view, significantly eroded the confidence we can have in this baseline view.
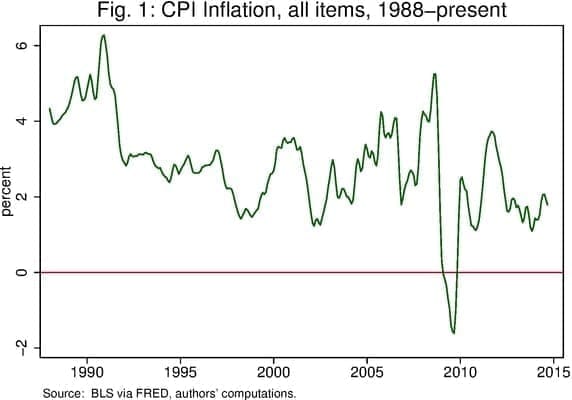
Let us go through some of the standard reasoning. First, the logic for discounting the effects of downward pressure from falling energy prices and a strengthening dollar seems clear. We have seen sharp changes in commodity prices and swings in the dollar many times before, and based on history it seems very likely that any influence these factors have on inflation will be transitory. So long as the stance of monetary policy seems broadly appropriate in other grounds, then, it would likely be counterproductive for policy to react to these factors. It may be easy to forget that as recently as late 2011, the headline inflation rate was pushed above 3-1/2 percent by such transitory forces (Fig. 1). At that time, the Fed correctly chose not to respond, and after a few months above 2 percent, inflation fell steadily for the next two years.
But today’s inflation context may be different. Clearly, one difference is that today’s transitory downward forces have arrived at a time when inflation has already been running below the Fed’s objective for more than two years. The FOMC has acknowledged that further extending this period may carry risks. A second difference is that downward moves from today’s low level would take inflation very close to zero. Thus, a much more modest shock could thrust the U.S. into deflation. Although economists do not agree entirely on why outright deflation is bad, most agree that it should be avoided. For these reasons, economists at the Fed and elsewhere will be squinting extra hard for signs that underlying inflation is behaving according to the baseline view.
In the pre-crisis years, core inflation–a measure that leaves out food and energy prices–was one reliable indicator of underlying inflation. Figure 2 shows CPI data for annual core inflation, starting in 1997, the year core inflation first crossed below 2.5 percent after the Great Inflation. From 1997 through the beginning of the crisis, this core inflation measure fluctuated in a narrow range around an average of 2.2 percent.2 Because CPI inflation tends to run a quarter point or more above the Fed’s preferred inflation measure, this average for core CPI inflation is broadly consistent with the Fed’s 2 percent objective for PCE inflation.
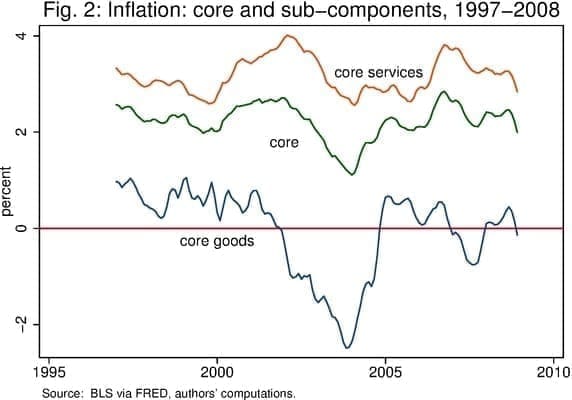
The stability in core inflation in the face of considerable variability in the headline measure (Fig. 1) was supported by another remarkable stability over this period. Separating core inflation into its goods and services components, we see that core services inflation ran consistently a bit over 3 percent, while core goods inflation ran at about zero.3
The roughly 3 percentage point percent spread in these component rates is due to the well-known phenomenon, first emphasized by Baumol,4 that productivity advances in the production of goods tends to outstrip productivity growth in services. The paradigm examples here may be haircuts and automobiles. The current method of producing a haircut would be recognizable to someone from 100 years ago; the current means of producing an automobile, however, is very different from even 20 years ago.
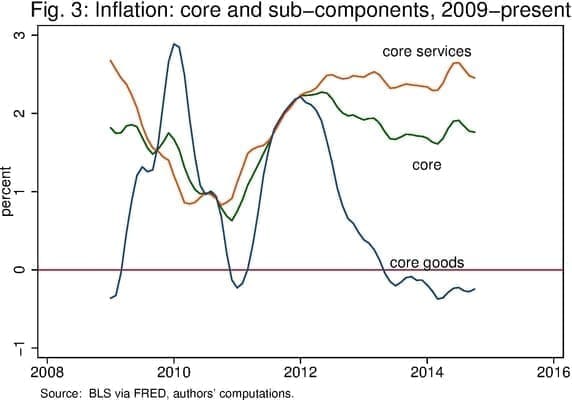
Then came the Great Recession. In its aftermath many familiar regularities have broken down. In particular, the comforting stability in core inflation and its main sub-components has broken down entirely (Fig. 3). Since the crisis, any stability we may have perceived in core inflation covers up immense transitory variation in the goods and services components. Note, in particular, that having briefly shown 2 percent deflation as the economy heated up in the early 2000s, core goods inflation was ramping up to nearly 3 percent in the darkest period of the crisis in late 2008 and early 2009. Core goods inflation registered another brief jump more recently. Since the crisis, at least, it does not seem that moves in core goods inflation have been a reliable indicator of underlying inflation trends.
So let us take this parsing and squinting a bit farther. Core services inflation has been much steadier than core goods inflation (Fig. 4). Having averaged just over 3.2 percent in the pre-crisis period, core services inflation fell to a low level and remained there through 2010. Beginning 2011, core services inflation bounced part of the way back, but for more than 3 years it has arguably been stable at a level almost a full percentage point below its pre-crisis norm.
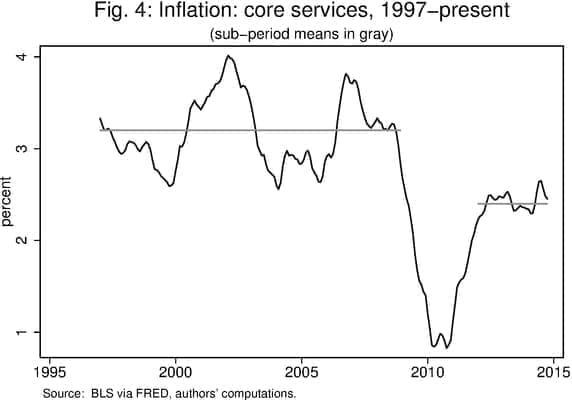
A mathematical certainty follows if core services inflation stays at this lower level. Either overall core inflation remains well below levels consistent with the Fed’s objective, or goods inflation must rise. This latter would imply a shrinking of the gap between goods and services inflation-that is, a shrinking of the Baumol effect. Neither the current level of core goods inflation nor our understanding of auto factories and barbershops provides support for the latter. Under this reasoning, if overall inflation is to return to a steady level near 2 percent, core services will have to resume its climb after more than a 3-year pause.5
Can we find evidence of such an increase? Throwing good sense to the wind, let’s consider stripping out some additional problematic inflation components in search of that shadowy beast, underlying inflation. Two categories of services inflation are often viewed with suspicion: medical services and owners’ equivalent rent. Roughly 10 percent of the core services inflation is represented by medical services, and medical services inflation has been puzzlingly low for two years now, helping to keep services inflation low. It would surprise no one, we suspect, to see medical inflation return to higher levels, pushing overall inflation a bit higher.
On the other hand, owners’ equivalent rent (OER), which gets about a 40 percent weight in the core services index, cuts hard in the other direction. The value of the OER component is supposed to reflect an answer to the question, “What are folks who own their own home paying, month-by-month, for the privilege of living in that home?” Since there is no market-based transaction taking place, the BLS must try to infer this value. Frankly no way of making up this number will be free of criticism, and analysts often discount moves in the OER component.6 It turns out, however, that OER inflation has been rising rapidly of late, and this climb combined with OER’s large weight in the index, has contributed to higher services inflation.
If we exclude both of these problematic categories from core services inflation, we get a measure of inflation that looks very much like that in Fig. 4.
Of course, most economists are probably counting on some upward impetus to inflation operating through a tightening labor market and rising wages. One might reasonably conjecture that core services, which are not directly subject to international competition nor to rapid productivity gains, constitute an area where we might expect to see most clearly the implications of a broad-based tightening in the labor market. This view underlies the baseline. One hears anecdotes that this process may be starting, but even squinting will not reveal it in the wage data to date.
Enough squinting. We come to two main conclusions. First, the pre-crisis regularities that formerly allowed us to reach a certain confidence about the direction of underlying inflation by looking at standard measures of core inflation have not prevailed in the period since the crisis. Confidence in the baseline outlook that inflation will gradually rise without further policy action cannot be extremely high, and in our view a wait-and-see-attitude is warranted. In FOMC-speak, policy surely must be data contingent.
Second, setting aside a vanishing Baumol effect, we will have to see core services inflation resume an upward climb if the baseline view is to be borne out. The apparent stability in core services for more than 3 years, however, suggests significant downside risk to the baseline view of rising underlying inflation.
Notes:
1. All inflation rates in this note are at an annualized rate and computed based on 3-month averages of the data. Thus, for example, the annual rates are for the average of the three months over the corresponding 3 months a year earlier.[back]
2. Going a bit further than squinting at pictures, econometric research by Faust and Wright of the CFE supports the idea that core inflation is a better predictor of headline inflation than is headline inflation itself. See Faust, J. and J. Wright, Inflation forecasting, Handbook of Forecasting, 2:A, 2013, G. Elliott and A. Timmermann eds., 2-56.[back]
3. There is one blemish in this story of stability–the 2 percent deflation in core goods in the early 2000s. We will return to this period later in the argument. For now, let’s just say that even including this period, analysts didn’t have to squint very hard to convince themselves of a good deal of underlying stability in inflation.[back]
4. This is sometimes called the Baumol Disease. Baumol, W. and W. Bowen (1966). Performing Arts, The Economic Dilemma: a study of problems common to theater, opera, music, and dance. New York: Twentieth Century Fund.[back]
5. Those prone to wishful thinking and willing to squint really hard might point to the uptick in core services inflation earlier this year as the beginning of a larger move. However, much of the climb has already reversed and measured quarter over quarter, core services inflation is now well below the average for the recent period.[back]
6. The Bureau of Labor Statistics provides an excellent discussion of these issues in How the CPI measures price change of Owners’ equivalent rent of primary residence. [back]