
Here’s the good news: The unemployment rate for young adult men is now lower than it was on the eve of the financial crisis a decade ago.
Here’s the bad news: So is the employment rate.
The explanation for those seemingly contradictory facts is that there has been a significant rise in the number of men between the ages of 25 and 29 who are not in the labor force—neither working nor looking for jobs—and therefore not counted in the unemployment rate (Fig. 1).
There are many reasons not to be in the labor force. Students are not in it, unless they are trying to work while going to school. Neither are retired people, those too sick to work or homemakers who stay home while their spouses work.
But most people have completed their schooling by the age of 25, and very few retire before they reach 30. Young people as a group are healthier than their elders, and there are probably not that many new house-husbands.
The answer may be that many of these men—who were aged 15 to 19 in 2008, as the crisis was beginning—are discouraged about their employment prospects. Many of them came out of school during the crisis or the recession that followed it, when unemployment rose to the highest level in a quarter century.
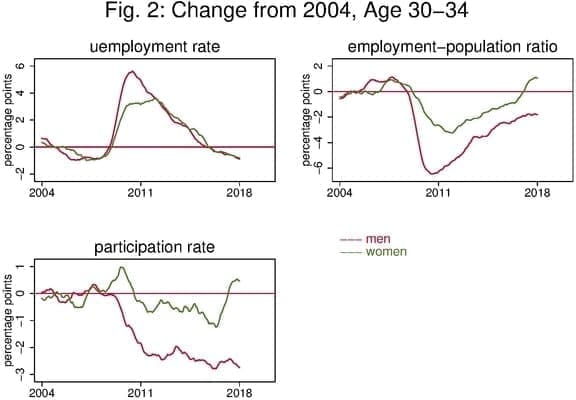
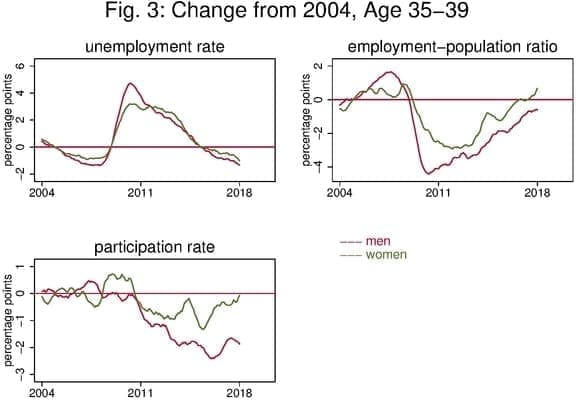
The aftereffects of the crisis are still being felt among groups of slightly older men, those now 30 to 34 and those 35 to 39 (Figs. 2 and 3). For both of those groups, the proportion of men in the labor force fell during the financial crisis and has not recovered, but the lingering drop gets smaller as one moves up in age.
It has long been known that workers who enter the job market for the first time during recessions not only have a tougher time of it at the beginning, but that the effects can linger for a lifetime – extending not only to earnings but even to health and mortality.[1]
The fact that the ill effects of the financial crisis appear to extend to men now 35 to 39—men who were 25 to 29 when the crisis hit—indicates that the problem can affect people who are early in their careers as well as those just beginning to work.
Young women seem to be doing just as well as earlier generations of young women. It is young men who are lagging.
There has been a trend for decades of declining labor force participation for men in the prime working years of 25 to 54, as the Federal Reserve noted this week in its recent Monetary Policy Report. But since 2008 the decline among young men, age 25 to 29, has been much faster than the one for men older than 30.
It should be noted that most young men are in the work force—87 percent of men 25-29, 90 percent of men 30-34 and 91 percent of men 35-39. But those percentages are lower than seen at any point from 1974, when the government began calculating the numbers, until the financial crisis began.
Something very different seems to be happening for people at the other end of the age spectrum. A higher proportion of men over 65 are in the labor force—and working—than ever before. In the late 1990s, when the economy was booming, about one out of six men aged 70 to 74 had jobs. The figure was about one in five when the economy peaked before the Great Recession. Now it is over 22 percent, a little more than one in five.
Among women the same age, fewer than one in ten had jobs in the late 1990s. Now the proportion is more than one in seven.
The decision to postpone retirement made by many senior citizens could reflect a high level of job satisfaction. But it also could stem from financial setbacks brought on by the crisis, or from the fact defined benefit pension plans have largely vanished for current workers in American corporations. Even those with ample retirement savings may fear outliving their money, and therefore hesitate to stop working.
Figures, with explanations below
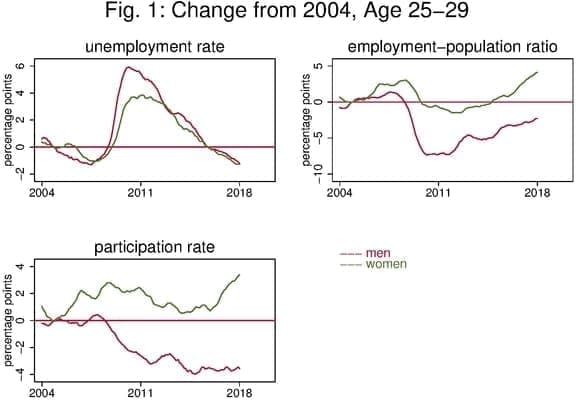
The figures show data from the BLS monthly household survey as reported in March 2018. Because the age groups are so narrow, the government does not try to apply seasonal adjustments. The figures show averages over the preceding 12 months, which overcomes seasonal issues and smooths month-to-month fluctuations.
Each line shows the difference in any one 12-month period, in percentage points, from the 2004 average. That baseline date was chosen because 2004 was a time of solid growth but before the debt-fueled boom that led to the crisis.
From left in each age group, the figures show changes from 2004 in the unemployment rate, the employment rate—known to economists as the employment-population ratio—and then below is the labor force participation rate.
Notes:
1. Hans Schwandt and Till von Wachter, Unlucky Cohorts: Earnings, Income, and Mortality Effects from Entering the Labor Market in a Recession. [back]
Floyd Norris is a CFE Fellow and Retired Chief Financial Correspondent, The New York Times