By Kevin Heerdt and Jonathan H. Wright
Economic data released by the government and other entities are being distorted by normally acceptable statistical methods. The extreme economic data that are coming out raise important issues of seasonal adjustment. Of course, there is no questioning the fact that the economic data are bad in an unprecedented way, but there is considerable difficulty in measuring just how bad the data are.
Seasonal adjustment is a mainstay of economic analysis (and forecasting) due to recurring annual cyclical patterns of economic activity. It is normally an essential adjustment to periodic releases such as employment and retail sales to compensate for the annual cycle of business activity: more active generally in certain seasons and less active in others, year by year. For example, one could expect construction to be more vibrant in the warmer months than in months when it is snowing, or retail sales (notably) are much larger in December (Christmas) than they are in July; seasonal adjustment normalizes activity based on regular cycles of activity.
One important issue is the use of multiplicative or additive seasonal adjustment, which is a modeling choice. An important series for which multiplicative seasonal adjustment is used is initial jobless claims. This means that the calendar effect is assumed to increase or reduce claims by a specific proportion (or multiplicative factor), rather than a specific number of claims. This is important because initial jobless claims are the most timely published macroeconomic data. In March, because the construction sector is typically opening up, jobless claims are lower. For example, for the week ending March 28, it is assumed that the seasonal effect is to lower initial claims by about 13 percent, and the seasonal adjustment consequently boosts the raw data multiplying it by 1.13.
This is perhaps a reasonable approach in normal times. But not now. Below is a table that gives recent weekly initial jobless claims, both seasonally adjusted and not seasonally adjusted. In the week ending, March 28 2020, the raw data was for 6.02 million claims which, seasonally adjusted, is 6.97 million claims. This is effectively saying that in the absence of any other shock, the seasonal effect should be to lower initial claims by nearly 1 million, as construction workers return to work return after the winter! That is absurd—initial claims never reached 1 million in the history of the series until this March. If you scaled the seasonal factor by pre-crisis levels of claims, the seasonal effect for that week would be something more like 30,000 which is a more reasonable seasonal effect.
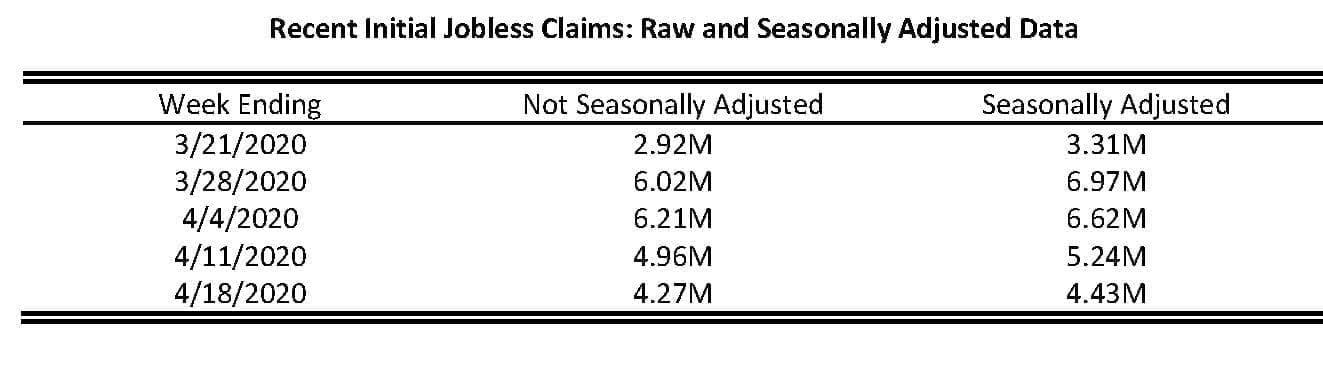
A simple way of seeing the problem is that the average absolute difference between seasonally adjusted and not seasonally adjusted claims in 2019 was 29,000. In the last five weeks, it has been 415,000.
The multiplicative approach does not work well with such an unprecedented shock. The number that is quoted in the press is invariably the seasonally adjusted number. But this is a case in which economists should just look at the raw data before any seasonal adjustment. That still paints a very grim picture, but not quite as bad. Over the past 5 weeks, cumulative initial claims are 24 million, instead of 26 million.
This is merely one example. Students of the market, economic forecasters, and commentators would do well to consider what data is being released and how it is adjusted. In some cases, statistical methods may overstate the truth – or understate it – unintentionally.
Another issue with seasonal adjustment to be aware of is that many series have concurrent seasonal adjustment, meaning that bad data lower the estimated seasonal factors in that time period. This can mean that seasonal adjustment makes the data look less bad than it really should be. This is true, for example, for nonfarm payrolls data and retail sales, but not for jobless claims. The seasonal factors for jobless claims are produced once a year and then fixed for that year. But, for all US macroeconomic series, the terrible data in spring 2020 will lower the seasonal factors in future years and this will make seasonally adjusted data appear unduly positive in future years. The only way of avoiding this echo effect is if the statistical agencies make an adjustment to prevent the coronavirus from having an impact on seasonal factors.