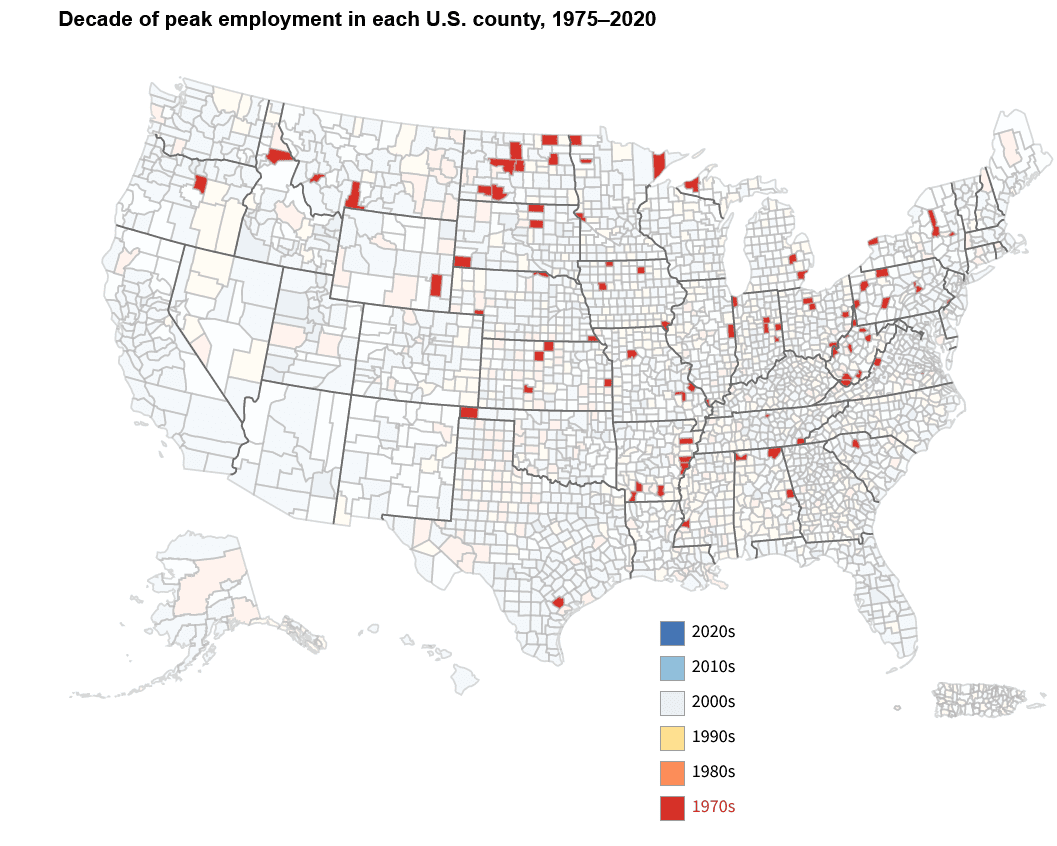
Job growth in the United States was distinctly uneven for decades before the Pandemic hit, a fact that was emphasized this week when the Bureau of Labor Statistics released a list of when each county in the United States reached its highest employment, based on data from 1975 to 2020.
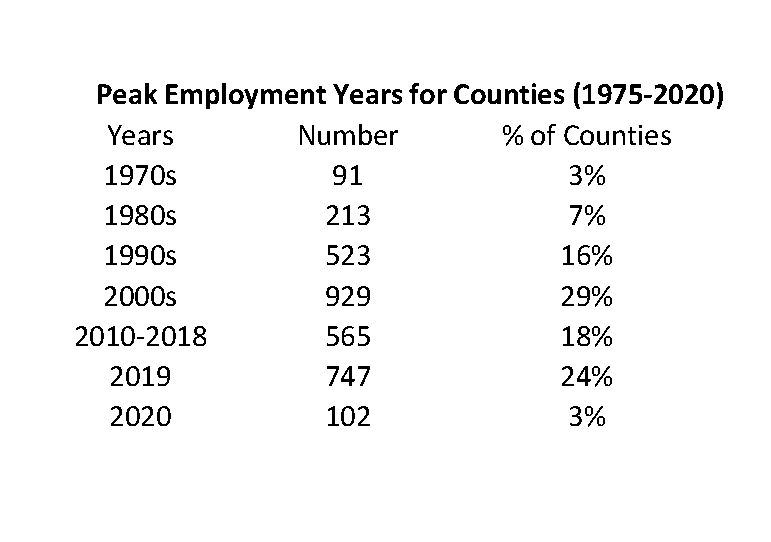
It showed that only 27% of the 3,170 counties reached highs in 2019 or 2020, and that 26% have not matched their 20th century highs even once in the new century.
These figures, it should be noted, are based on the location of the job, not the residence of the worker. And they reflect the average employment of the 12 months in each year.
Some of the most discouraging job figures in the late 20th century were in cities that had been industrial powerhouses in the years following World War II and failed to cope with the decline of major industries.
I looked at the performance of the counties that included the 10 most populous cities in the 1950 census. In six of them employment peaked more than two decades ago, and jobs in two of them are about a quarter less than at the peak.

The other four recorded their highest employment totals in 2019, before the Pandemic hit. New York is a special case, which I’ll get to below. The other big counties that set records that year were Los Angeles County, which includes a large suburban area outside the city, Washington, D.C. and Suffolk County, MA, where Boston is located.
As for New York City, each of the five counties in it – called boroughs by the locals — reached peaks in 2019, but Manhattan’s share was sliding even before the Pandemic hit.
Its share of the city’s jobs, at 63% in 2014, was just 56% in 2019 (and 55% in 2020). In the five years from 2014 to 2019, the number of jobs in Brooklyn rose 40%, and the numbers in the three other outer boroughs were up around 30%. The Manhattan figure was up only 1% over those five years. All five boroughs lost jobs in 2020, with Manhattan suffering the most, and the figure for the entire city was down 11%. Figures for 2021 have not been released.
Of the 102 counties that set new highs for employment in 2020, the largest was Utah County, whose biggest city is Provo. It had more than 253,000 jobs.
In three small counties, the job figures for 1975 have not been matched since then. The largest of them is Ontonagon County in Michigan’s Upper Peninsula. It had an average of 1,241 jobs in 2020, 70% less than the 1975 figure of 4,082. The others, each of which had fewer than 800 jobs in 1975, are the Upper Yukon Division in Alaska and Wheeler County in north central Oregon.